RaceLyx prints the reports a club needs, but some directors want the raw numbers for their own analysis: who improved, who is consistent, how the classes compare. Results, Final saves a whole event as spreadsheets, and History exports any one session. Everything is CSV, which opens in Excel, Google Sheets or Numbers.
Before you start
- The event's sessions saved to Results.
- For the Final tab, pick the event at the top of Results if it is not the active one.
Step by step
- 1
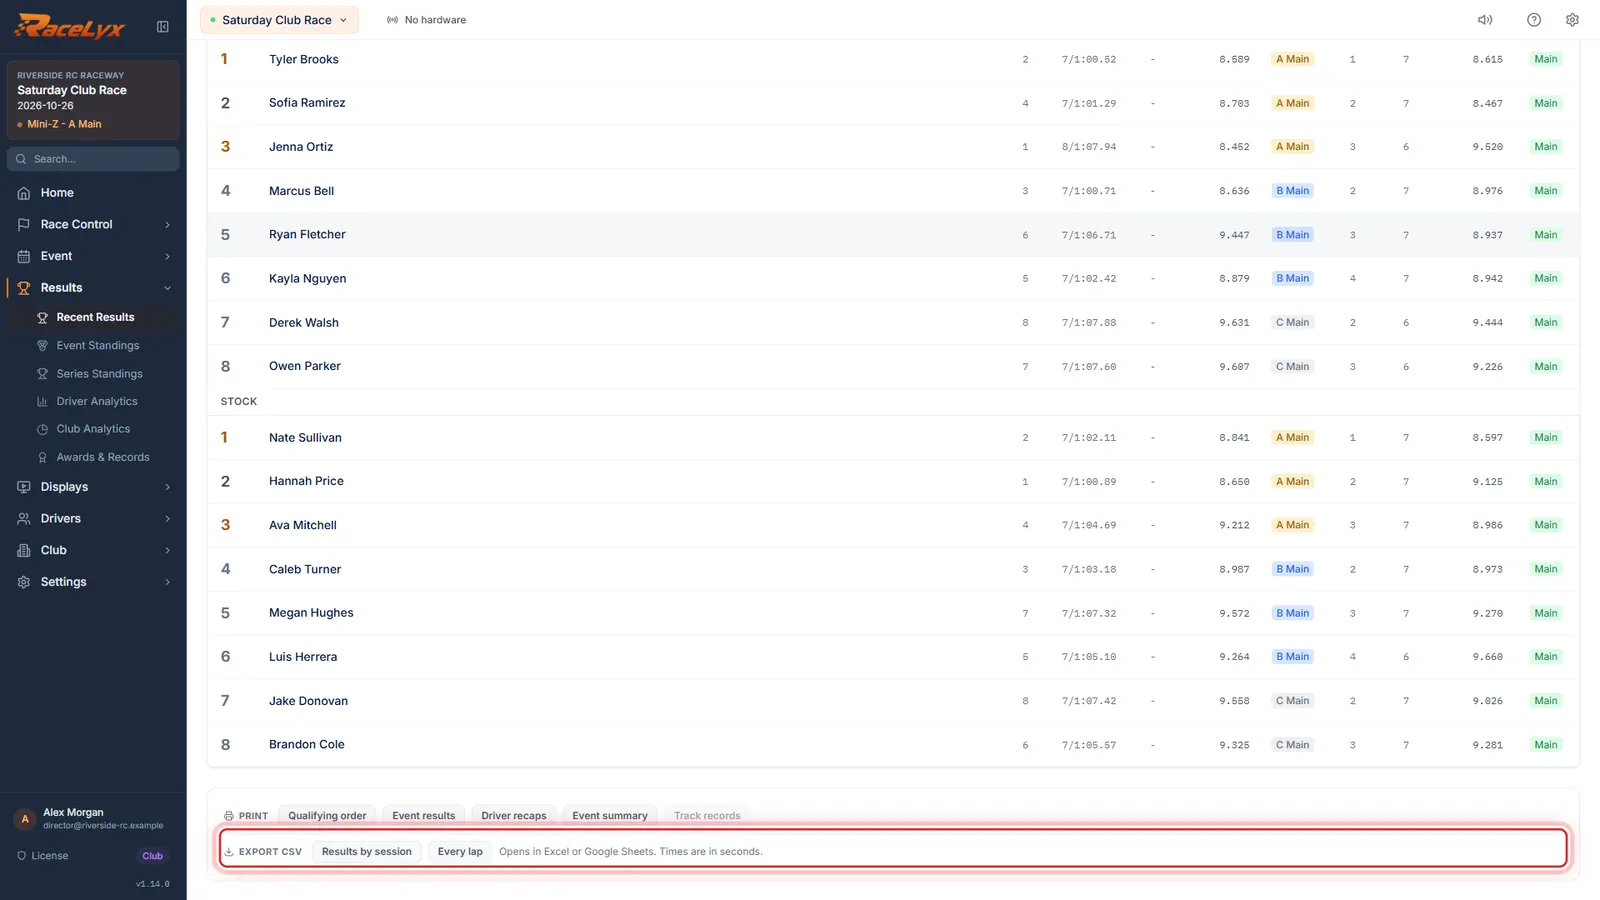
Results, Final: Export CSV
Open Results, Recent Results, and the Final tab. Under the Print bar, Export CSV saves the whole event as a spreadsheet.
Compute Results first if the tab asks for it. The export covers every class in the event, whichever class the tab is showing.
- 2
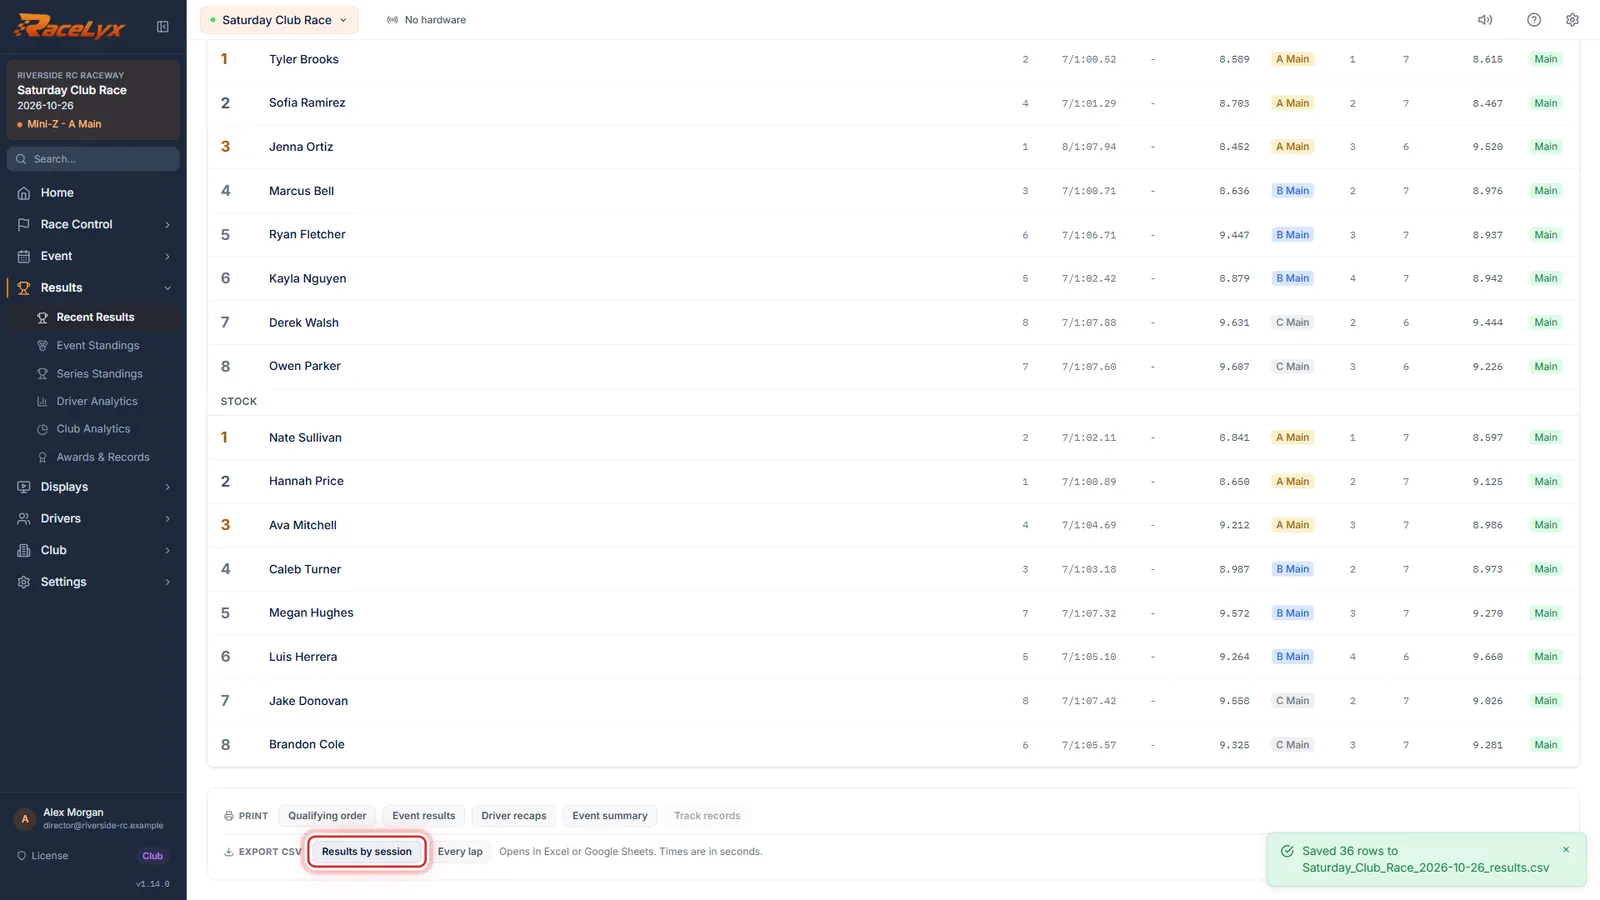
Results by session
Results by session is one row per driver per session. Best lap, average, typical lap, consistency, and where each driver qualified and finished.
RaceLyx asks where to save the file, then says how many rows it saved. Times are in seconds with three decimals.
- 3
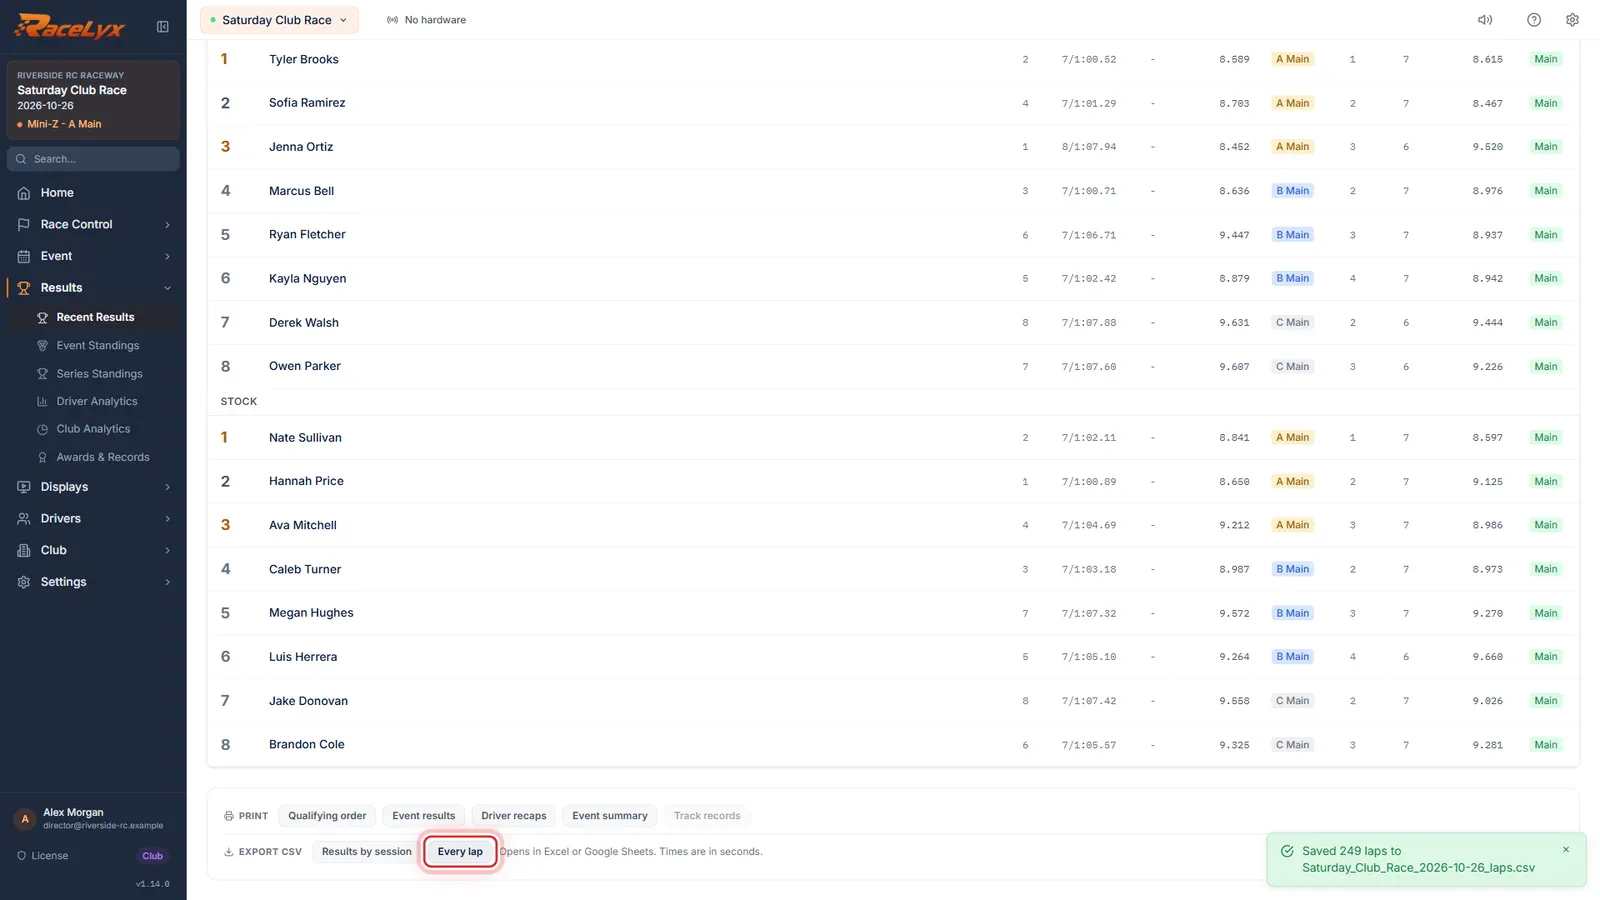
Every lap
Every lap is one row per lap, for every driver in every session. That is the one for lap charts.
Each lap has an In stats column and a note: Start lap, Excluded or Best lap, so your averages match RaceLyx's.
- 4
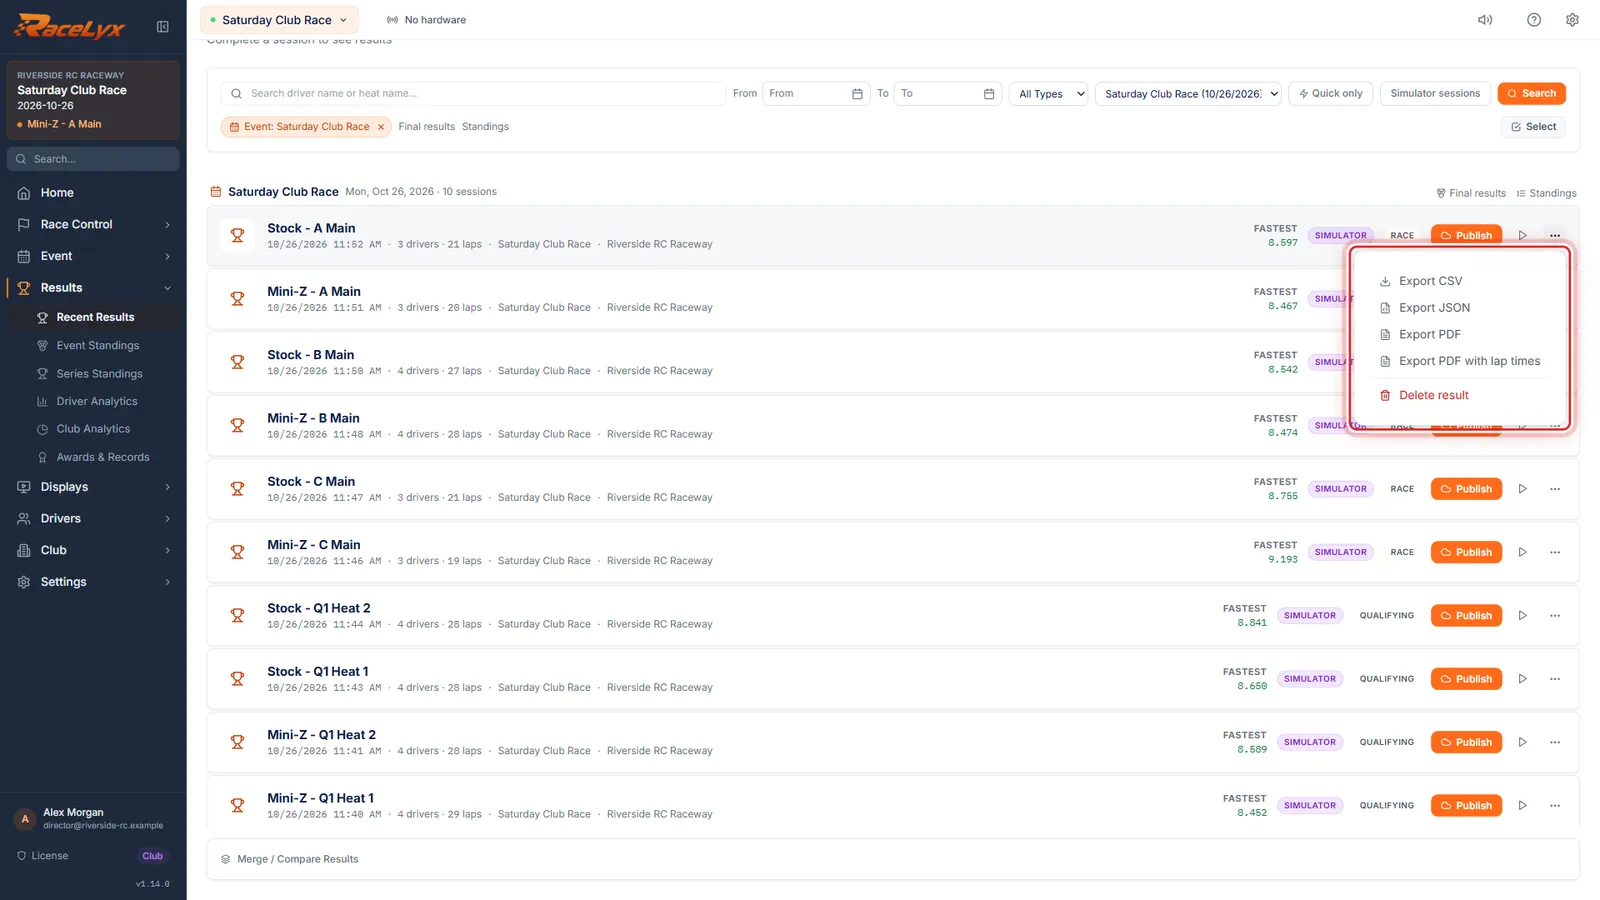
One session: More actions
For just one session, open History and click More actions on its row. Export CSV, JSON, or a PDF with or without lap times.
Export JSON has everything RaceLyx saved for the session, for your own code. The PDFs are the same sheets as Print.
- 5
Look for Export CSV
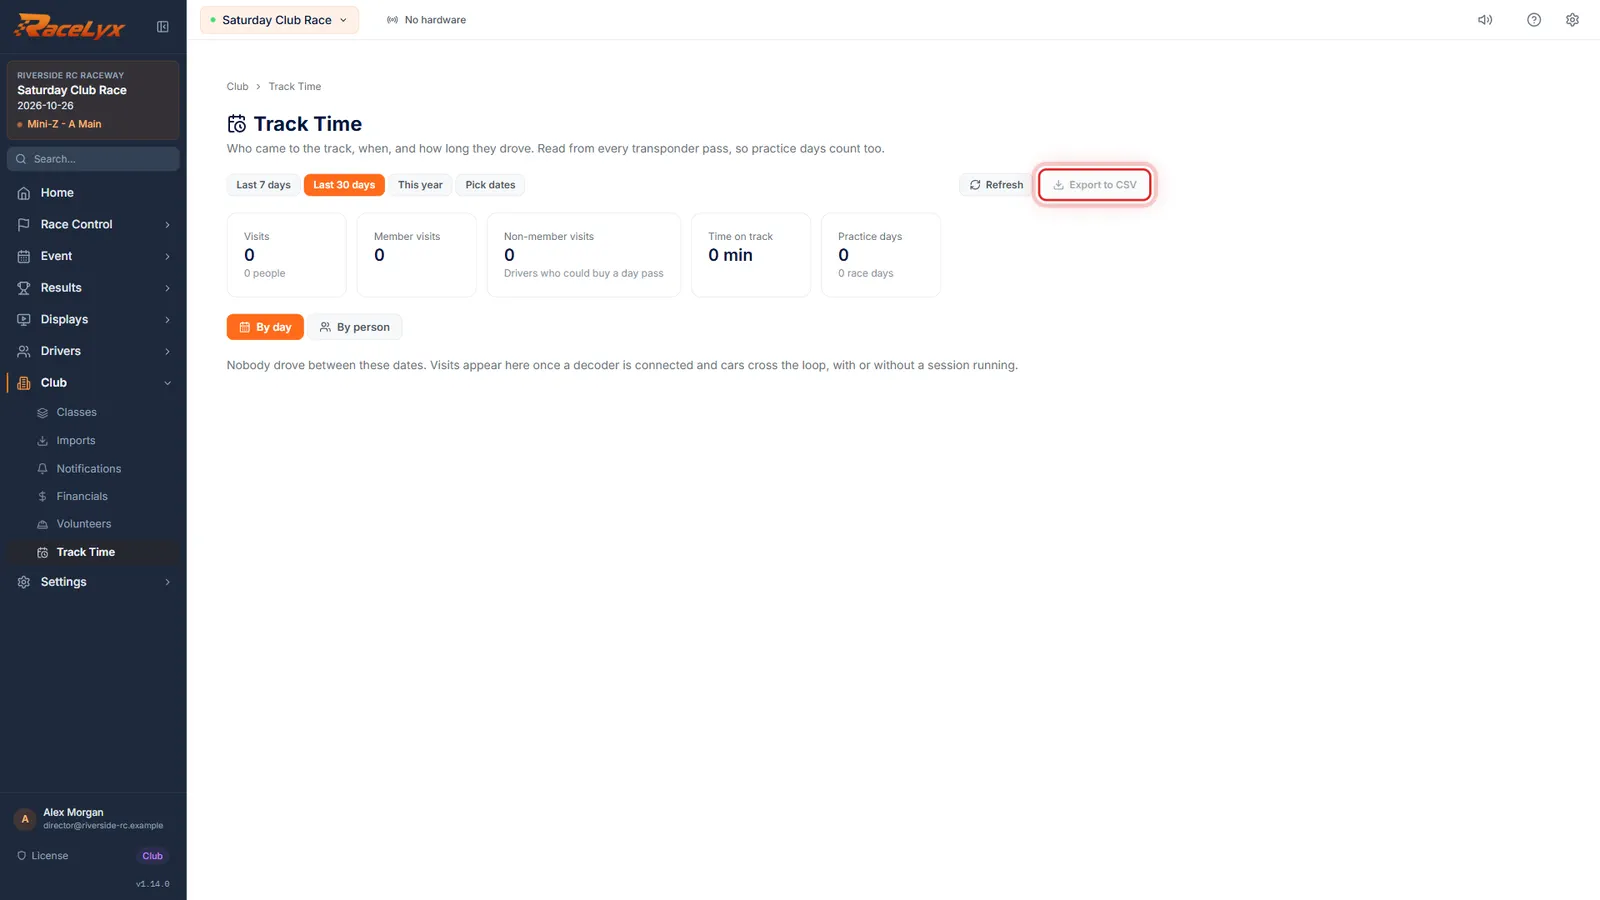
Other screens export too. Here on Track Time, it is Export to CSV. Series Standings, Financials, Members and the check-in log have one as well.
Track Time: Export to CSV. Series Standings: Export CSV. Check-In: Check-in tools, Log, Export CSV. Financials, Members, Waivers and Volunteers each have their own.
Tips
- Results by session: one row per driver per session for the whole event, with event, date, session, class, round, heat, main, position, driver, car number, transponder, laps, total time, best lap, best 3 in a row, average, typical lap, consistency, clean and mistake laps, gap, status, and where the driver qualified and finished.
- Every lap: one row per lap of every driver in every session, with a note for the start lap, excluded laps and the best lap. Use it for lap charts.
- Times are in seconds with three decimals, so a spreadsheet treats them as numbers. Transponder numbers keep their leading zeros.
- Two files, not one, because a CSV holds one table: join them on driver and session if you need both.
- One session: History, More actions on the row: Export CSV, Export JSON, Export PDF, or Export PDF with lap times.
- Other lists export too: Check-In, Check-in tools, Log (the check-in log), Series Standings (Export CSV), Track Time (Export to CSV), and Financials, Members, Waivers and Volunteers.
- Published sessions can also be downloaded from your results page on live.racelyx.com, by anyone.
Troubleshooting
- Pick an event first.
- Choose the event at the top of Results, then press the export button again.
- The qualified and finished columns are empty.
- RaceLyx could not work out the standings for that event (for example, no qualifying was saved). The session rows are still saved; those two columns stay blank.
- Excel shows the times as text.
- Open the file with File, Open (or double-click it) rather than pasting it. The times are plain seconds, like 12.345.
Related guides
Something here does not match what you see? Tell us and we will fix the guide.